Services · Custom dashboards
Custom dashboard development: one view of the business everyone trusts.
If someone builds your Monday report by hand and you still can’t see which clients make money, we build a custom dashboard that pulls your CRM, ads, accounts and operations into one live view, set up around the decisions you make each week.
Decisions made on the same, trusted numbers, the week they matter rather than at month end.
Part of Internal tools & dashboards
You’ll recognise this
- Monday starts with someone exporting numbers from five tools into a spreadsheet.
- Two people bring two different revenue figures to the same meeting.
- You only find out a channel or a client went wrong at month end.
- Off-the-shelf BI tools were bought, and nobody opens them.
01 What it’s costing you
The expensive part is the part nobody invoices.
When numbers are assembled by hand they arrive late, and they arrive disputed. The cost is not the analyst’s hours; it is every decision made a month too late, or on the wrong figure. For example, a pipeline total copied from a CRM export on Friday is already out of date by the Monday meeting.
-
Lever 01
Spend where it returns
Marketing spend joined to signed revenue, so budget moves to the channels that produce clients.Moves: Cost per acquired client -
Lever 02
Problems caught early
Over-servicing, slipping projects and unpaid invoices flagged as they happen, not discovered at month end.Moves: Margin per client or project -
Lever 03
Hours back from reporting
Reports that build and send themselves, freeing senior people for the work the numbers point to.Moves: Time spent compiling reports
02 Built for
Who brings us this work.
The people who usually start these engagements, what they are measured on, and the question they arrive with.
-
Founders of B2B service firms
You founded a B2B service business, and sales and delivery have outgrown your inbox, your memory and your best salesperson’s phone.
You watch: Pipeline, win rate and revenue per person
- Enquiries arrive faster than anyone can answer them, and the good ones go cold over a weekend.
- The CRM is half filled in, so your forecast is a guess and follow-up depends on memory.
- Every new client seems to need another hire, because a person sits in the middle of every step.
What changes: Every lead answered and followed up, a pipeline you can believe, and growth that doesn’t need a new hire for every few clients.
“We are not a tech company. Custom software sounds big and risky.”
We start with a short, fixed scoping sprint and one small build. You see it working within weeks and decide every next step on what it did.
03 Before and after
The same week, run two ways.
Today
- Numbers compiled by hand each week
- Different figures in the same meeting
- Problems found at month end
- BI tools nobody opens
With the system in place
- Live figures from every source
- One agreed definition per number
- Alerts the day something moves
- Views built around real decisions
04 In your business
What this looks like on an ordinary week.
Three situations owners tell us about, and what changes once this is in place.
-
Scenario 01
The Monday spreadsheet
Say someone spends Monday morning exporting numbers from your CRM, ads and accounts, pasting them into a spreadsheet and emailing it round. By the time it arrives, the meeting has started.
With it in place: The numbers are live on one dashboard before anyone arrives, and the person who built the spreadsheet does real work instead.
-
Scenario 02
Which clients actually make money?
Say you know your revenue, but not the profit on each client, because hours sit in one tool and invoices in another.
With it in place: A dashboard puts hours and fees side by side per client, so you can see who to raise prices for and who to let go.
-
Scenario 03
Finding out too late
Say cash gets tight because three big invoices went overdue, and nobody noticed until the bank balance did.
With it in place: The dashboard alerts the right person when invoices, pipeline or capacity cross the line you set.
05 What we build
Custom dashboards, designed around your work.
The numbers your business runs on, pulled live from every source, with the record behind each figure one click away.
Data pipelines
Scheduled pulls from your CRM, ads, analytics, accounting and databases into one clean, documented store.Decision dashboards
Views designed around specific decisions: where to spend, which clients need attention, what to hire for.Drill-down to the record
Every figure clicks through to the deals, invoices or jobs behind it, so numbers can be checked, not argued about.Alerts
Notifications when a number crosses a threshold you set, so problems surface the day they happen.Role-based views
Leadership, team leads and clients each see the figures they need, and only those.Scheduled reports
Weekly and monthly reports generated and sent automatically, in your format, to the people who need them.
- CRM & pipeline
- Ads & analytics
- Accounting
- Operations data
Data pipeline & dashboard
Built for one business, owned by it
- Decision views
- Drill-down to records
- Threshold alerts
- Scheduled reports
06 Working thesis
A dashboard is a decision, not a chart.
Most dashboards fail because they were designed around the data available rather than the decisions people make. They show everything, so nobody looks at anything.
We start from the decisions: who decides what, how often, and on which numbers. Then we build the smallest view that supports each decision, and make every figure traceable so it earns trust.
07 How it runs
Working software early. Then the next step.
Phases, not promises: every engagement starts with a scoping sprint, and each step is decided on evidence.
-
01
Weeks 1–2
Decisions and definitions
Agree which decisions the dashboard serves and one definition for each number, with the people who use them.
-
02
Weeks 3–6
First dashboard live
Pipelines from the key sources and the first decision view in use, checked against the numbers you trust today.
-
03
Ongoing
More sources, alerts, reports
Further sources, alerts and scheduled reports added as the first view earns its place.
Works with the tools you keep
- Google Analytics 4
- Google Ads
- Meta Ads
- HubSpot
- Salesforce
- Xero
- QuickBooks
- Stripe
- Google Sheets
- PostgreSQL
- MySQL
- Any REST API
08 Built in-house
We build this for ourselves first.
Scribbify runs software products of its own. Each one is the same kind of work, tested on our own business before yours.
-

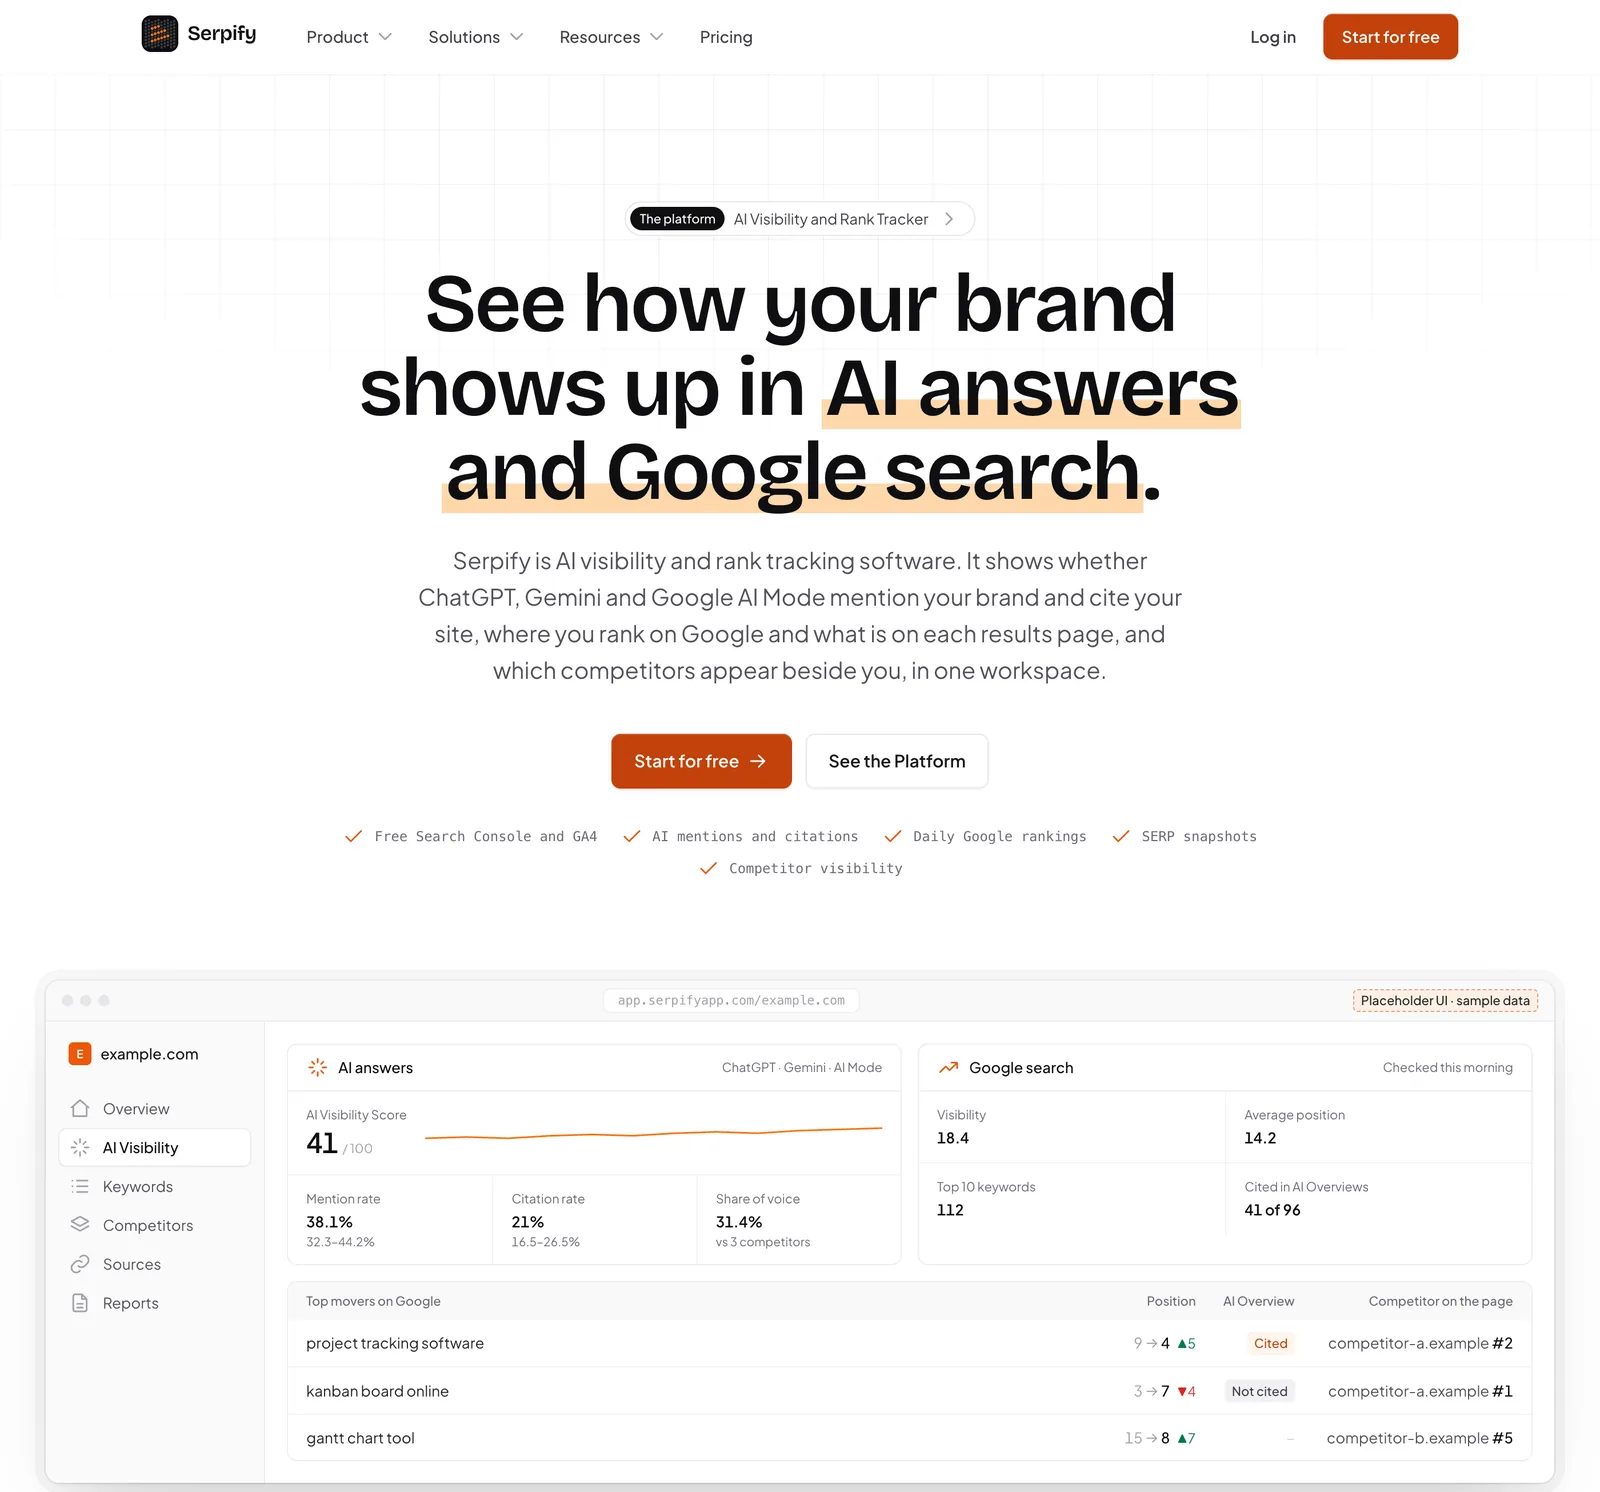
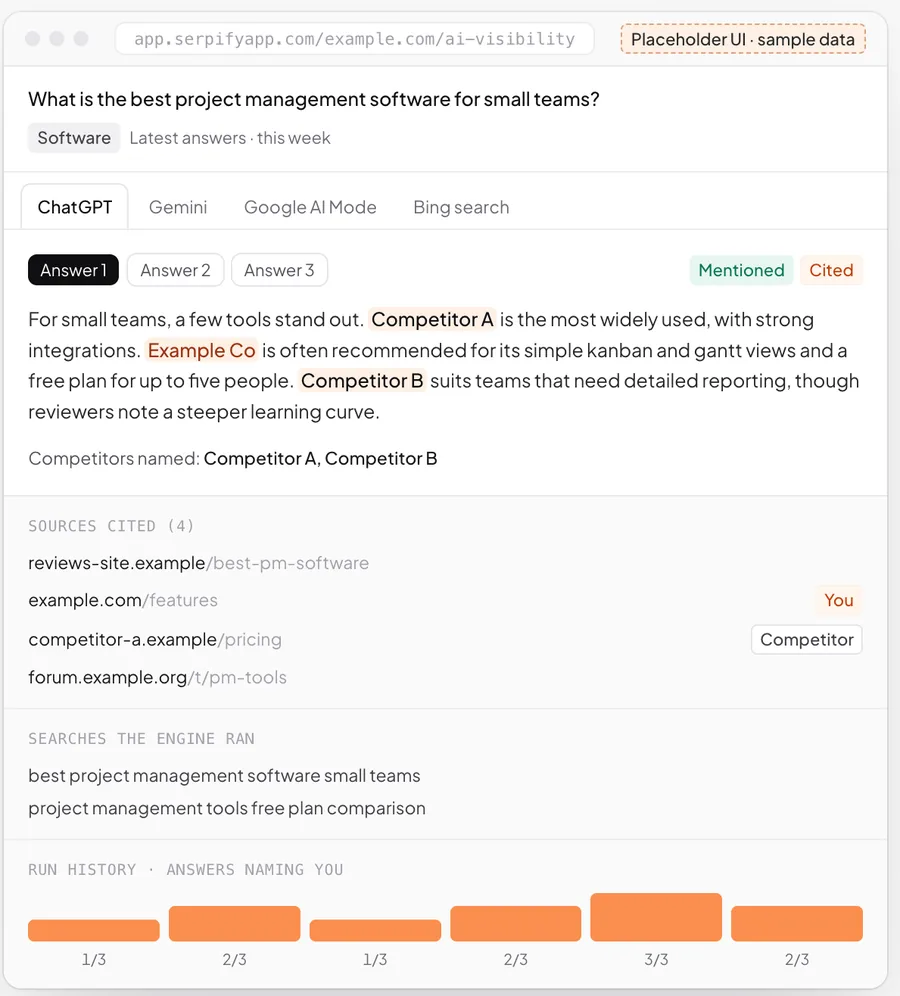
Serpify · AI visibility and rank tracking
Daily data pipelines from many sources into dashboards, reports and alerts: the same engineering as an operations dashboard.
About Serpify -

LeadSpidey · AI SDR for inbound leads
Live lead feed and team metrics, from leads today to meetings booked, updated as conversations happen.
About LeadSpidey
09 Build, buy or configure
An honest comparison.
Sometimes software you can buy is the right answer, and we will say so. This is how we weigh it.
| What matters | Off-the-shelf SaaS | Low-code builder | Scribbify build |
|---|---|---|---|
| Fits how your team actually works | Partly: You adapt to its fields | Partly: Until the rules get complex | Yes: Built around how you work |
| You own the code and the data | No: Rented | Partly: Locked to the platform | Yes: Yours, documented |
| Joins every tool you already use | Partly: Where integrations exist | Partly: Simple connections | Yes: Any API or export |
| Cost stays flat as you hire | No: Priced per seat | No: Priced per seat | Yes: No per-seat licence |
| AI agents with approvals built in | Partly: Generic assistants | Partly: Add-ons | Yes: Built for your rules |
| Someone accountable for the outcome | No: A support ticket | No: Your own team | Yes: Measured with you |
10 Questions
Before you write.
More services
Why build a custom dashboard instead of using Looker Studio or Power BI?
Which data sources can you connect?
How live is the data?
What if two systems disagree on a number?
Can clients see their own dashboard?
Who maintains the pipelines?
How long until we see the first dashboard?
Start a project
Talk to us about custom dashboards.
Tell us where the work or the revenue gets stuck: the job, the tools it runs on and what it costs you. We will tell you plainly whether building is worth it.
- A partner reads every enquiry
- A 45-minute working call
- A written scope you can decide on
Or write to us at [email protected]
All services